Page 2 · Jobs
Where I turned messy operations and data into product direction.
Three jobs, from the engine room to the product team: an AI product management internship at IDeaS, an operations internship at Daikin, and a summer keeping tour boats running in Alaska.

Value-Based Priority System for Line Issues
- Process Improvement
- Power Automate
- Figma
- Cost Modeling
- Supervision
Resume highlights
- Built a value-based priority system for daily issues and integrated it with IT products. Cost Savings: $900k
- Used Figma to guide the development of an enterprise software to improve communication between departments across the company and gather more data in less time. Cost Savings: $130k
- Led lean process improvement projects to increase safety and efficiency. Cost Savings: $150k
- Designed and automated a data collection system using Power Automate. Cost Savings: $80k
- Identified pain points through employee interviews and implemented process improvements across departments.
- Performed daily supervisor tasks such as managing labor, stand up meetings and KPI presentations.
Situation
- While shadowing the supervisors and talking to operators, they would always talk about the product engineering issues that slowed down their line.
- While talking to product engineering, they would always talk about how much they needed to manually sort through emails to act on issues.
- The quality team had a custom data collection software that was unused by other departments.
Task
- My task was only to fill in for supervisors when needed.
Action
- I automated data entry using Power Automate.
- I wrote requirements to update the custom manufacturing software using Figma and a business requirements document.
- I assigned manufacturing engineers to be the owners of future efficiency efforts related to the IT systems.
Results
- Expected costs saved: $900k in projected potential savings, assuming the cost of daily line issues is normally distributed.
- Was given a return offer for a full time supervisor position.
$900k
Projected potential cost savings from the value-based priority system.
$230k
Potential cost savings from 10 additional self-driven projects.
Return offer
For a full-time supervisor position.
Line issue cost calculator
Adjust the drivers of a single line issue to see the modeled cost that feeds the prioritization formula.
What the line produces in a day. Lost time takes away from this.
Minutes the issue takes out of the day, for revenue and wages.
Operators waiting on the issue, paid at $50/hr.
Downstream stations knocked out of sync.
Scrapped material on the issue.
Risk-weighted safety exposure of the issue.
Modeled issue cost
$22,175
issue = Revenue Lost + Employee Labor Cost + Station Sync Cost + Parts Cost + Safety Penalty
20 min of a 480-minute production day
6 operators × 20 min × $50/hr
4 stations out of sync
40 lb × $0.55/lb
Risk level 3
This is a visualization of the model, not the real one. The rates, weights and assumptions here are illustrative and do not reflect Daikin's actual numbers.
Current architecture
How the value-based prioritization system works today.
Team lead enters data
Into a structured email
Power Automate
Auto-fills the engineering issues list (4,000 items long)
Formula
Calculates cost and prioritizes the issue
Future requirements
The proposed streamlined data path.
Employee enters data
Into the quality software
Data goes directly to engineers
How information moves through the plant
I mapped every path an issue takes from the floor to the people who can fix it, and what each path costs in time.
Current state: seven channels between the floor and engineering
Future state: three channels, priority filtered
Management flow chart
What a supervisor has to know every day, and where I proposed it should live.
Current state
The same shift's information lives on seven physical and digital dashboards.
- Gemba boards
- Turn overs / efficiency data
- Pelico shortages
- RCI data
- Labor tracking per area
- Prioritized engineering items
- Flagged completions
Fragmented across boards and screens, so it takes too long to communicate and priorities get lost.
Future state
One aggregated dashboard
Every source above in one place, so a tier meeting reads the same numbers instead of hunting for them.
Idea: about $50k a year saved in lost time
Studied up
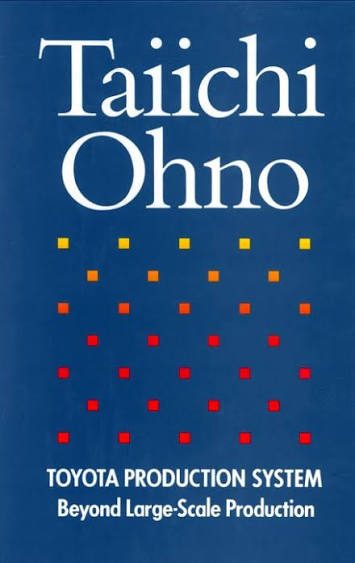
Toyota Production System: Beyond Large-Scale Production
Taiichi Ohno
Source of efficiency ideas applied at Daikin.
The 10 additional projects (a sample)
Self-driven efficiency work alongside the priority system.